Waterfall Plot#
Using CARTA#
Select
HDU 0(orHDU Waterfalldepended on hifast version) in the hdf5 file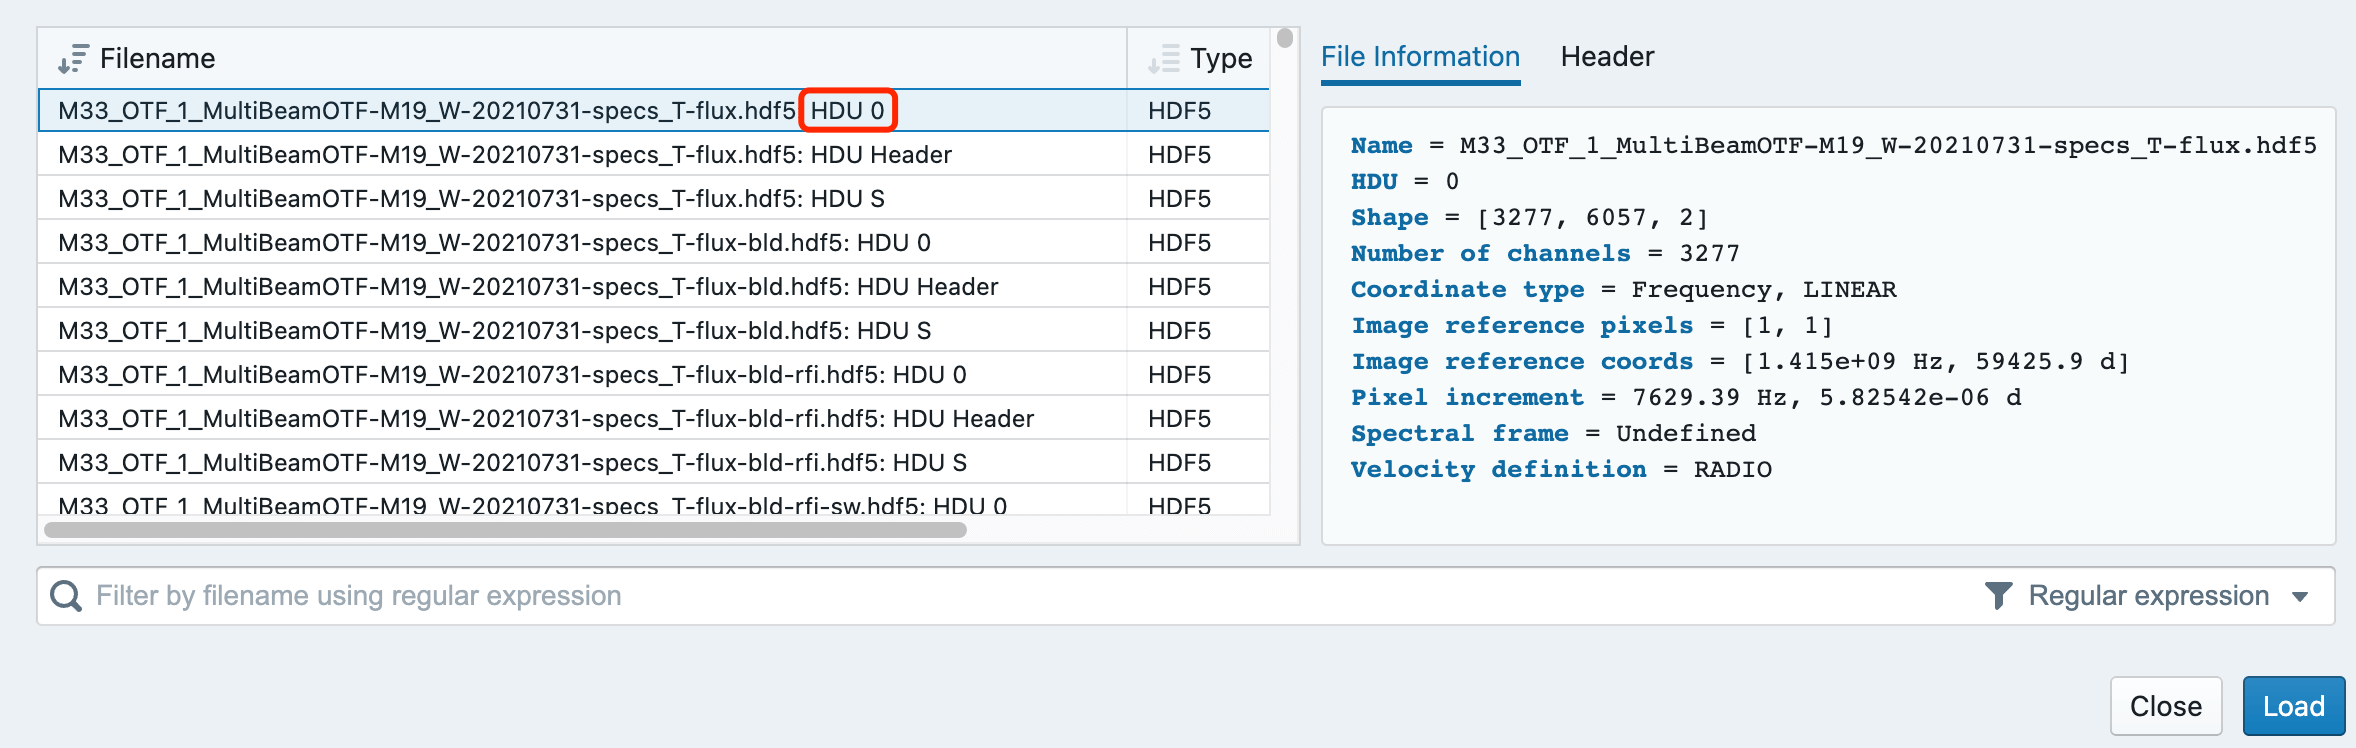
As shown in the following image

hifast.waterfall#
hifast.waterfall: Create a waterfall plot and save as a PDF
Example
python -m hifast.waterfall data_S/M33_OTF_1_MultiBeamOTF-M*_W-XXX-specs_T-flux.hdf5
Input hdf5 files generated during the hifast processing, multiple files can be specified using wildcards.
Key parameters:
-s:By default, the input files are grouped, and the 19 beams observed on the same day are plotted on one chart for output.Adding
-swill draw each file separately and save it in the file.
--vmin, --vmax: The data range used for the colormap in the chart. You can specify a number or a percentage. The default setting is--vmin per0.01 --vmax per95.
--interpolation: This is the parameter for plt.imshow